


⚡
Presentation
I have 4 years of experience in Data Entry and related tasks. I provide accurate and reliable services including Excel and Google Sheets data entry, copy-paste work, PDF to Word/Excel conversion, web research, data collection, and document formatting. I am detail-oriented, hardworking, and committed to completing every project accurately and on time.
🖼️
Portfolio
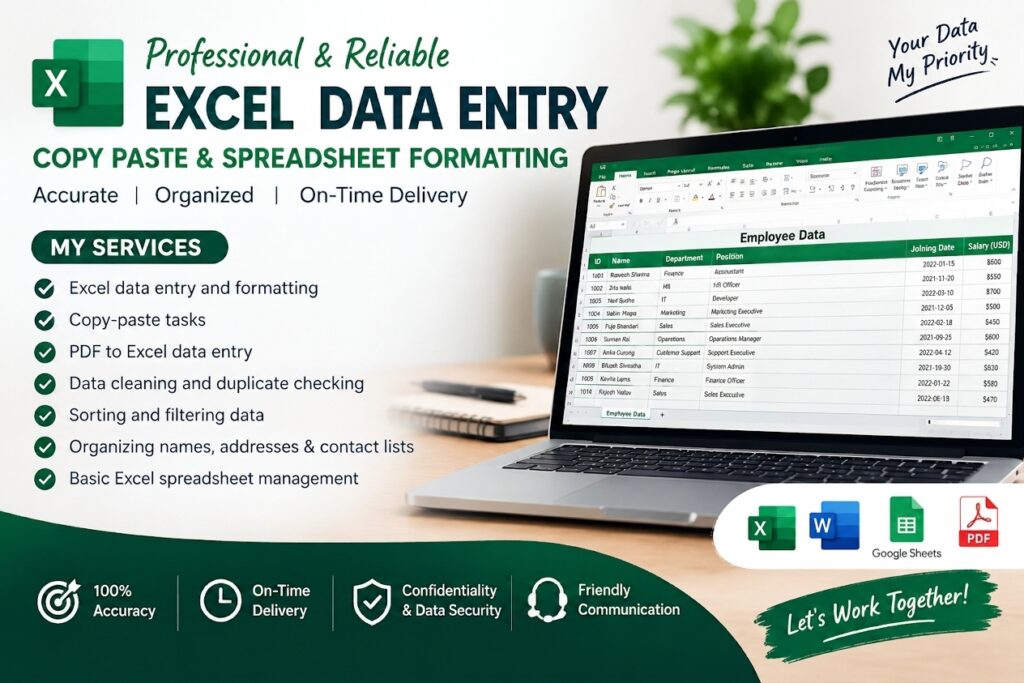
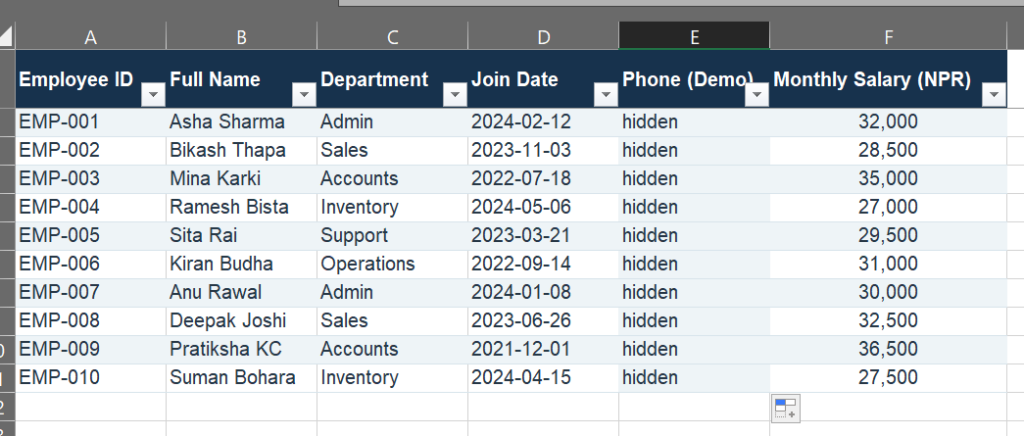
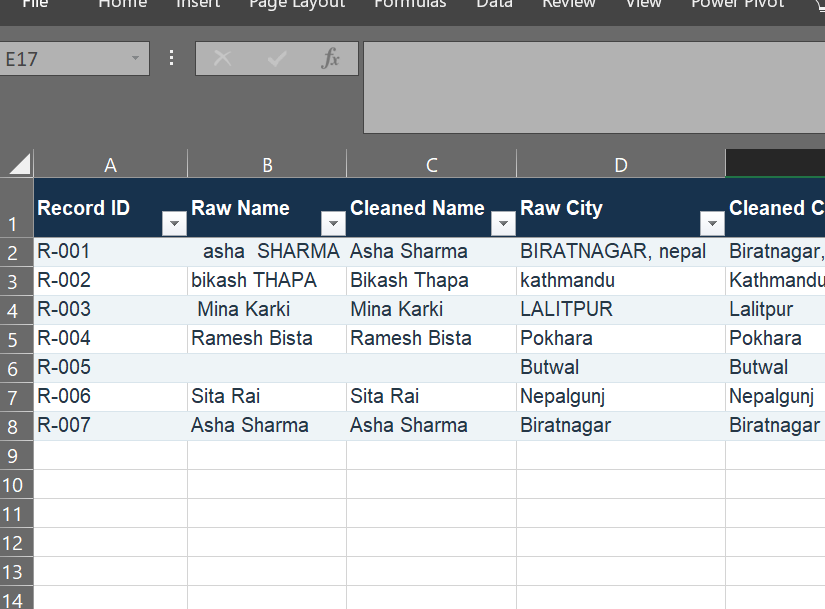
🛠️
Offered services
🔑
I will do pdf Conversion excl,word,powerpoint, photo to pdf, handwriting to pdf
professional PDF Conversion Services
I will convert your PDF files into editable Word documents and Excel spreadsheets with accurate data and clean formatting.
My Services:
PDF to Word
Word to ...
5 $ Per hour

I will do B2B lead generation, web research, and build targeted business email lists
Hello!
I will help you find targeted business leads and organize contact information in Excel or Google Sheets.
My Services:
B2B lead generation
Business contact list building
Web research and data ...
5 $ Per hour
I will do accurate Excel data entry, copy paste, and spreadsheet formatting
Hello!
I can help you with accurate and organized Excel data entry tasks.
My Services:
Excel data entry and formatting
Copy-paste tasks
PDF to Excel data entry
Data cleaning and duplicate ...
5 $ Per hour
📋
Background
data entry specialist
Worked as a Data Entry Specialist at Nepacart Logistic, Lagankhel, Lalitpur, Nepal. Responsibilities included entering and updating data accurately, maintaining digital records, organizing information in Excel spreadsheets, checking data for errors and inconsistencies, preparing and formatting documents, and maintaining organized records. Supported daily office operations by ensuring data accuracy, consistency, and timely completion of assigned tasks.
virtual assistant
Worked as a Virtual Assistant at Shree Amba Group Pvt. Ltd., located in Kuleshwor, Kathmandu, Nepal. Responsibilities included data entry, maintaining and organizing digital records, managing Excel spreadsheets, preparing and formatting documents, conducting online research, updating business information, and providing administrative support. Focused on maintaining accurate records, completing assigned tasks efficiently, and supporting daily office operations.
Master of arts
Successfully completed a Master of Arts (M.A.) in Economics. Developed knowledge of economic theory, data analysis, research methods, statistics, and economic policy. Gained analytical and problem-solving skills useful for research, reporting, data interpretation, and administrative work.
📄PDF
excel tips and tricks
Successfully completed the free online course “Excel Tips and Tricks” offered by Great Learning Academy on November 11, 2024. This course helped me improve my understanding of Excel features, spreadsheet formatting, and practical techniques for organizing data efficiently. I aim to apply these skills to data entry, spreadsheet management, and data organization tasks.
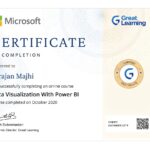
Data visualization with power BI
Completed a Data Visualization with Power BI course in October 2020. Gained knowledge of importing, cleaning, transforming, and analyzing data using Microsoft Power BI. Learned to create interactive dashboards, charts, graphs, and reports to present data insights effectively and support data-driven decision-making.
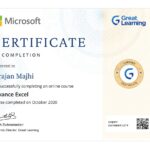
advance excel
Completed an Advanced Excel course from Great Learning in October 2020. Gained knowledge of advanced Excel functions and formulas, data sorting and filtering, data cleaning, PivotTables, charts, conditional formatting, and data analysis. Developed skills in organizing, managing, and analyzing data efficiently using Microsoft Excel.
🇬🇧English 🇮🇳Hindi
🕐
Working hours
Monday
From08h00To18h00
Tuesday
From08h00To18h00
Wednesday ▪ Today
From08h00To18h00
Thursday
From08h00To18h00
Friday
From08h00To18h00
Saturday
From08h00To18h00
Sunday
Closed
⭐
Reviews
Please sign in as a customer to give your feedback
💬
No reviews yet.
Be the first to share your experience with this professional.