

⚡
Presentation
📊 What I Do:
Clean & organize messy data, build Excel dashboards, create charts/visualizations, and write Python scripts to automate your data tasks.
🛠️ Tools I Use:
✔ Microsoft Excel (Pivot Tables, VLOOKUP, Charts, Formatting)
✔ Python (NumPy, Matplotlib, Pandas)
✔ Google Sheets
⭐ Why Choose Me?
✔ On-Time Delivery
✔ 100% Accuracy
✔ Free Revisions
✔ Quick Response
✔ Clear Communication
📩 Message me before ordering — let's turn your data into insights!
Clean & organize messy data, build Excel dashboards, create charts/visualizations, and write Python scripts to automate your data tasks.
🛠️ Tools I Use:
✔ Microsoft Excel (Pivot Tables, VLOOKUP, Charts, Formatting)
✔ Python (NumPy, Matplotlib, Pandas)
✔ Google Sheets
⭐ Why Choose Me?
✔ On-Time Delivery
✔ 100% Accuracy
✔ Free Revisions
✔ Quick Response
✔ Clear Communication
📩 Message me before ordering — let's turn your data into insights!
🖼️
Portfolio
📋
Background
Freelance Data Analyst (Excel & Python)
Providing data analysis and dashboard development services for individuals and small businesses. Specialize in cleaning raw datasets, building interactive Excel dashboards with pivot tables and visualizations, and writing Python scripts (Pandas, NumPy, Matplotlib) for statistical analysis and reporting.
Key deliverables:
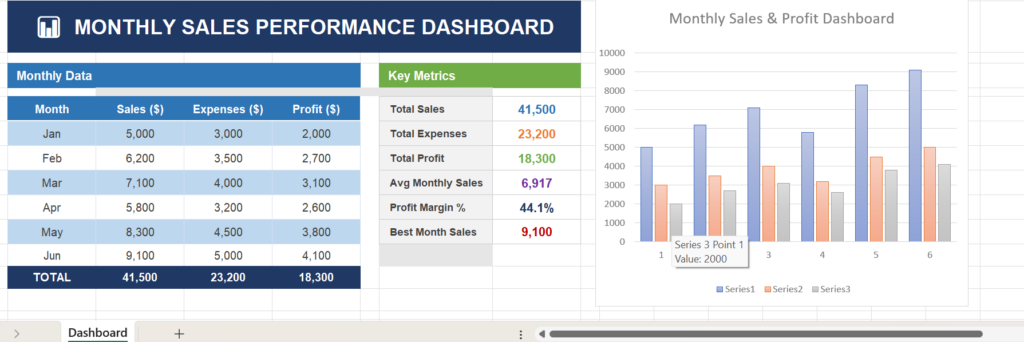
- Excel dashboards with dynamic charts and KPI tracking
- Data cleaning and structuring for accuracy and consistency
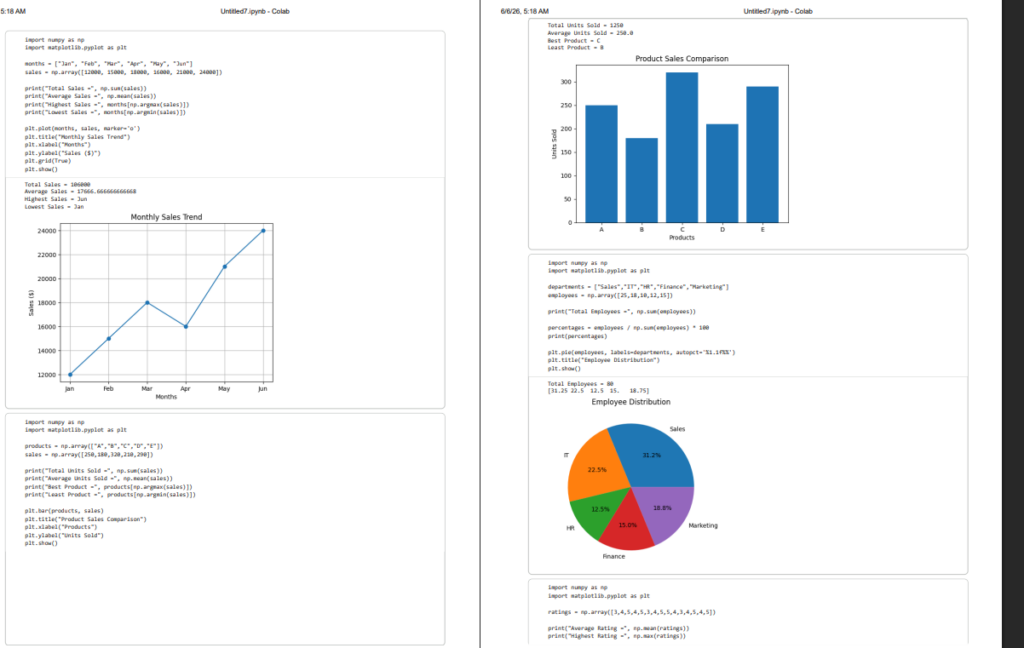
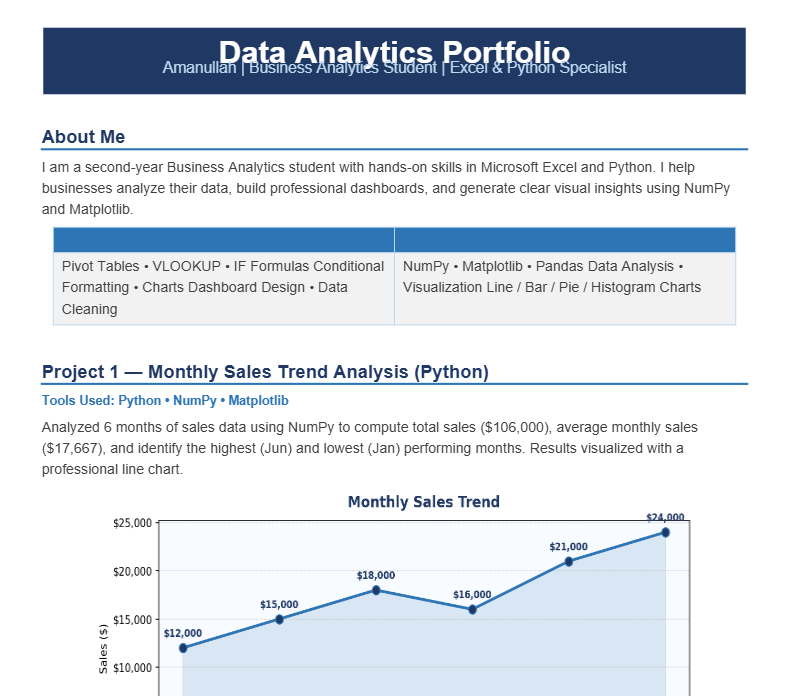
- Python-based data analysis with visualized insights
- Clear, actionable reports for business decision-making
Tools: Microsoft Excel, Python, Google Sheets, Jupyter Notebook
Key deliverables:
- Excel dashboards with dynamic charts and KPI tracking
- Data cleaning and structuring for accuracy and consistency
- Python-based data analysis with visualized insights
- Clear, actionable reports for business decision-making
Tools: Microsoft Excel, Python, Google Sheets, Jupyter Notebook
business analytics
Bachelor of Science in Business Analytics | szabist university islamabad2025 – 2029 (Expected)Core Focus: Developing a strong foundation in data-driven decision-making, statistical modeling, and business intelligence strategy.Technical Framework: Acquiring hands-on proficiency in core analytics tools, including SQL database management, Microsoft Excel for advanced data manipulation, and Tableau for interactive data storytelling.Business Acumen: Learning to translate complex operational data into actionable strategic insights to optimize business performance and solve market challenges.Academic Projects: Participating in case studies focused on predictive modeling, financial analysis, and market trend forecasting.
🇬🇧English 🇵🇰Urdu
🕐
Working hours
Monday
From08h00To18h00
Tuesday
From08h00To18h00
Wednesday
From08h00To18h00
Thursday
From08h00To18h00
Friday
From08h00To18h00
Saturday ▪ Today
Closed
Sunday
Closed
⭐
Reviews
Please sign in as a customer to give your feedback
💬
No reviews yet.
Be the first to share your experience with this professional.