
⚡
Service overview
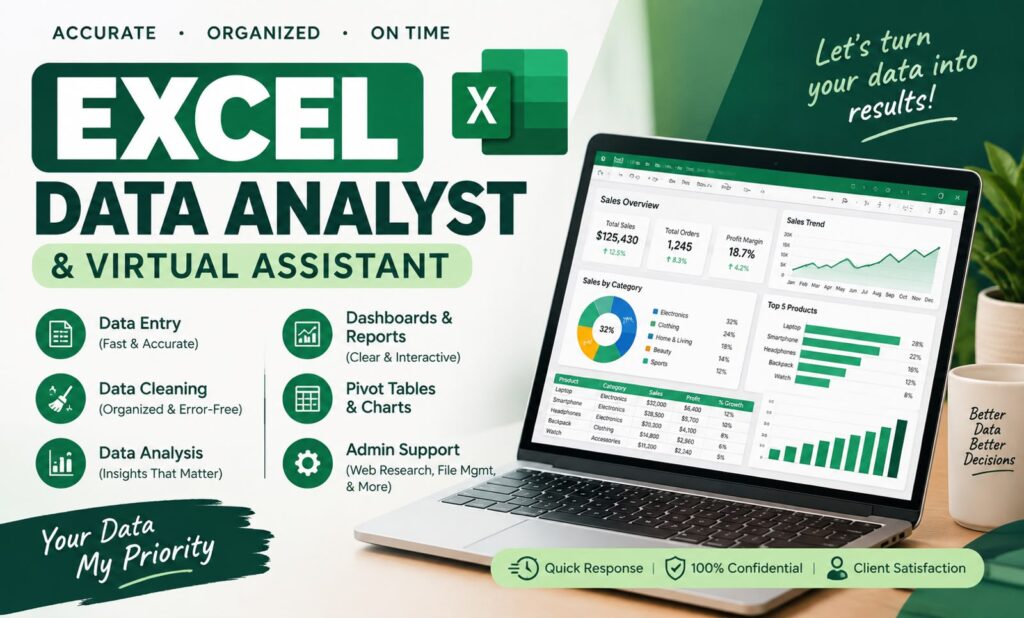
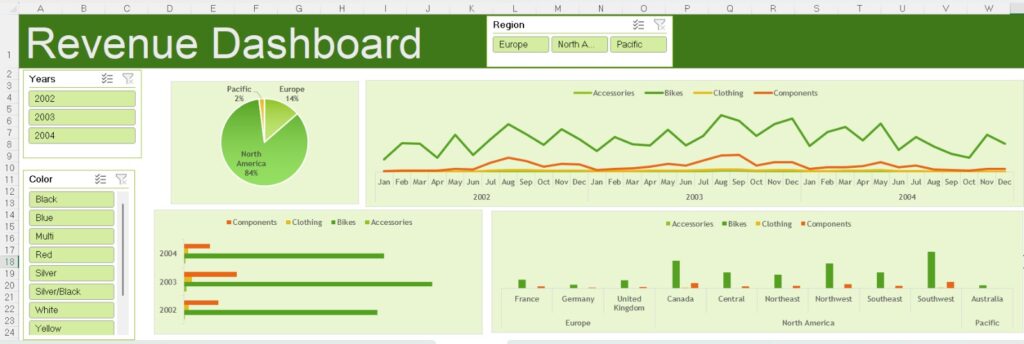
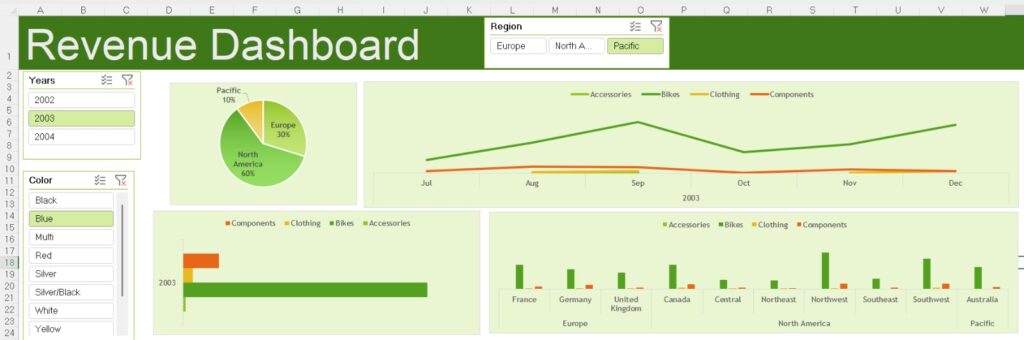
Turn your raw data into a clear, interactive Excel dashboard that shows you what matters at a glance.
Instead of scrolling through endless rows, you get a clean visual report where you can filter and explore your numbers with a single click.
What's included:
• Interactive slicers and filters (by year, region, product, category, etc.)
• KPI cards showing your key numbers (total revenue, profit, sales, growth)
• Professional charts: pie, bar, line and combo charts
• Pivot tables connected to the dashboard
• Data cleaning and formatting so your numbers are accurate
• Custom color theme to match your brand
• Easy updates: paste in new data and the dashboard refreshes
Ideal for:
✔ Sales and revenue tracking
✔ Business and financial reports
✔ Inventory and expense monitoring
✔ HR and attendance data
✔ Research and survey data
✔ Student projects and presentations
Why choose me:
I'm a Data Analyst with hands-on experience in data cleaning, reporting and dashboard creation in Excel, backed by a Data Analytics & BI certification. I focus on accuracy, clean design and dashboards that are simple enough for anyone to use.
What I need from you:
1. Your data file (Excel or CSV)
2. The questions you want the dashboard to answer
3. Your preferred colors (optional)
You'll receive:
✔ A ready-to-use Excel dashboard file
✔ Free revisions until you're satisfied
✔ A short guide on how to use and update it
Not sure what you need? Message me before ordering and I'll suggest the best layout for your data.
Instead of scrolling through endless rows, you get a clean visual report where you can filter and explore your numbers with a single click.
What's included:
• Interactive slicers and filters (by year, region, product, category, etc.)
• KPI cards showing your key numbers (total revenue, profit, sales, growth)
• Professional charts: pie, bar, line and combo charts
• Pivot tables connected to the dashboard
• Data cleaning and formatting so your numbers are accurate
• Custom color theme to match your brand
• Easy updates: paste in new data and the dashboard refreshes
Ideal for:
✔ Sales and revenue tracking
✔ Business and financial reports
✔ Inventory and expense monitoring
✔ HR and attendance data
✔ Research and survey data
✔ Student projects and presentations
Why choose me:
I'm a Data Analyst with hands-on experience in data cleaning, reporting and dashboard creation in Excel, backed by a Data Analytics & BI certification. I focus on accuracy, clean design and dashboards that are simple enough for anyone to use.
What I need from you:
1. Your data file (Excel or CSV)
2. The questions you want the dashboard to answer
3. Your preferred colors (optional)
You'll receive:
✔ A ready-to-use Excel dashboard file
✔ Free revisions until you're satisfied
✔ A short guide on how to use and update it
Not sure what you need? Message me before ordering and I'll suggest the best layout for your data.
🖼️
Pictures
⭐
Reviews
Please sign in as a customer to give your feedback
💬
No reviews yet.
Be the first to share your experience with this professional.