
⚡
Service overview
Design and develop an integrated reporting system using Power BI to transform GTX's sales data into interactive strategic insights. The project aims to monitor global financial performance and identify growth opportunities through a rigorous analysis of sectors and regions.
Technical Features:
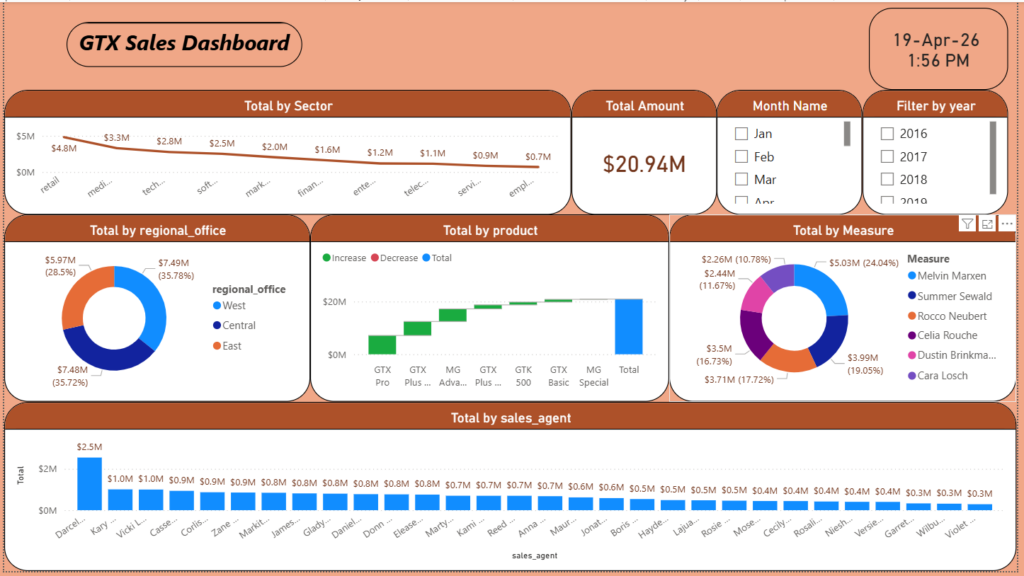
Total revenue analysis: Monitor total sales of $20.94 million as a key performance indicator (KPI).
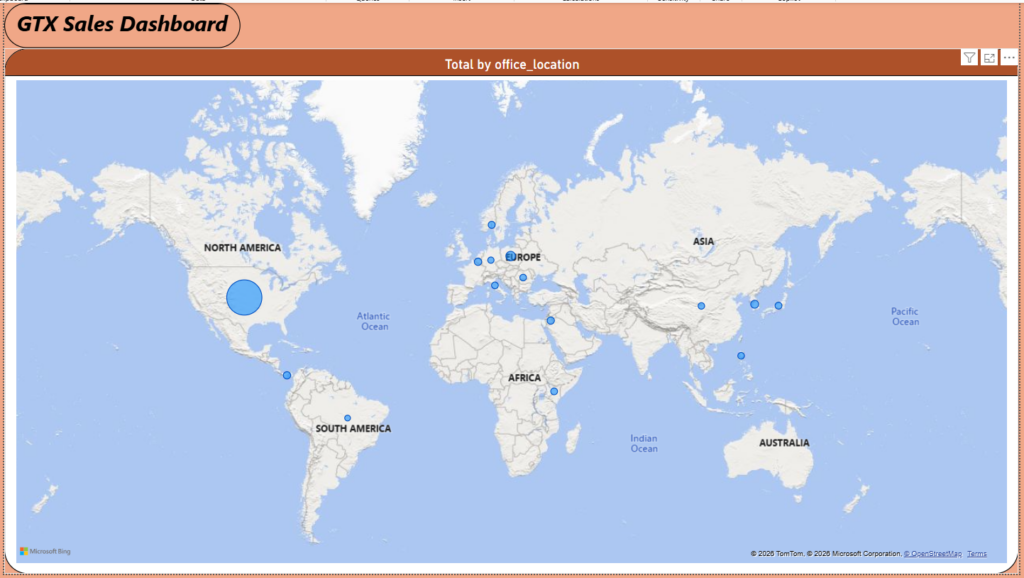
Map Analysis: Interactive mapping of office locations around the world (North America, Europe, Asia) to track the spread of sales globally.
Waterfall Chart: Demonstrate the impact of products (e.g. GTX Pro and MG Advanced) on the final revenue structure.
Area Chart: Track the performance of the retail, medical, and technology sectors to identify the most profitable areas.
Team and Regions Performance: Using Donut Charts to analyze sales by regional offices (East, West, Central) and measure the productivity of sales managers.
Rep Rating: An outline of the performance of individual sales reps to monitor the achievement of goals.
Intelligent Interactive System: Advanced filters for months and years (2016-2019) to enable the user to extract custom time reports.
Tools: Power BI, Power Query, DAX.
Technical Features:
Total revenue analysis: Monitor total sales of $20.94 million as a key performance indicator (KPI).
Map Analysis: Interactive mapping of office locations around the world (North America, Europe, Asia) to track the spread of sales globally.
Waterfall Chart: Demonstrate the impact of products (e.g. GTX Pro and MG Advanced) on the final revenue structure.
Area Chart: Track the performance of the retail, medical, and technology sectors to identify the most profitable areas.
Team and Regions Performance: Using Donut Charts to analyze sales by regional offices (East, West, Central) and measure the productivity of sales managers.
Rep Rating: An outline of the performance of individual sales reps to monitor the achievement of goals.
Intelligent Interactive System: Advanced filters for months and years (2016-2019) to enable the user to extract custom time reports.
Tools: Power BI, Power Query, DAX.
🖼️
Pictures
⭐
Reviews
Please sign in as a customer to give your feedback
💬
No reviews yet.
Be the first to share your experience with this professional.