

⚡
Presentation
Power BI specialist with experience in commercial and marketing reporting (KPIs, sales funnels).
Creating interactive reports and dynamic dashboards combining data modeling, DAX, and clean UX/UI design.
Business-oriented with a results-driven approach.
Portfolio online:
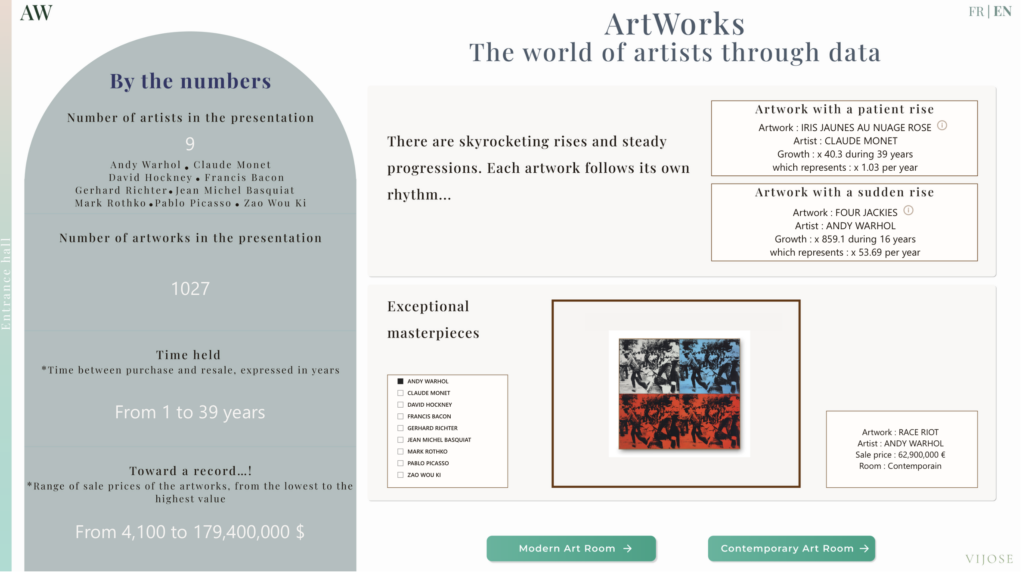
– ArtWorks Project: interactive gallery inspired by an exhibition in Giverny → bit.ly/ArtWorks_vijose
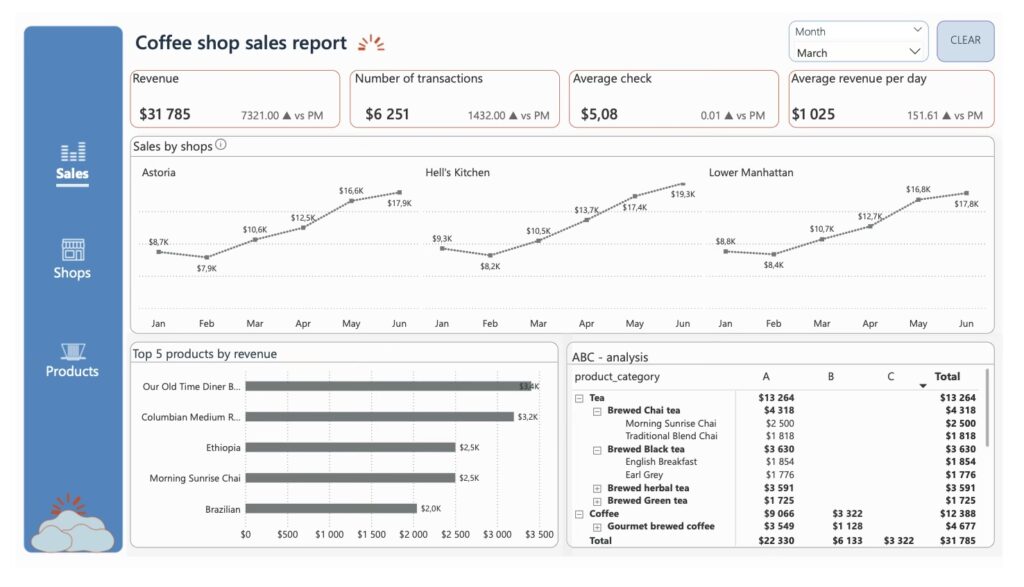
– Coffee Shop Sales Analysis: Power BI → Behance
Skills & Achievements:
– Designing precise, user-friendly Power BI dashboards with intuitive navigation and key KPIs for fast decision-making.
– Data preparation and transformation using Power Query, creating custom measures with DAX.
– Building clear, structured visualizations that simplify analysis and presentation of results.
– Continuously improving SQL, DAX, and dashboard design skills through real-world projects.
Tools: Power BI, DAX, Power Query, Figma, SQL
Creating interactive reports and dynamic dashboards combining data modeling, DAX, and clean UX/UI design.
Business-oriented with a results-driven approach.
Portfolio online:
– ArtWorks Project: interactive gallery inspired by an exhibition in Giverny → bit.ly/ArtWorks_vijose
– Coffee Shop Sales Analysis: Power BI → Behance
Skills & Achievements:
– Designing precise, user-friendly Power BI dashboards with intuitive navigation and key KPIs for fast decision-making.
– Data preparation and transformation using Power Query, creating custom measures with DAX.
– Building clear, structured visualizations that simplify analysis and presentation of results.
– Continuously improving SQL, DAX, and dashboard design skills through real-world projects.
Tools: Power BI, DAX, Power Query, Figma, SQL
🖼️
Portfolio
📋
Background
FREELANCE BI ANALYST & DASHBOARD DESIGNER
– Designed and developed interactive dashboards in Power BI, combining precise data analysis with smooth navigation to enhance the user experience, with particular attention to clarity and insight
readability
– Prepared and transformed data using Power Query; created customized measures with DAX
– Delivered clear and structured visualizations with intuitive navigation and relevant KPIs to support understanding and decision-making
– Continuously strengthened skills in SQL, DAX, and dashboard design through applied projectsProjects:
● Coffee Shop Sales Analysis — see on Behance: https://www.behance.net/vijose
● ArtWorks Project — interactive gallery inspired by an exhibition in Giverny: Power BI report - bit.ly/ArtWorks_vijose
Parallel project (CRM & Sales Data):
– Designed a CRM structure and sales funnel tailored for a growing B2B client
– Built a client journey map, segmented the customer base, and developed workflows for lead tracking and strategic follow-up
– Identified new growth opportunities and created a categorization logic with reminder-based reactivation flows
– Project based on prior experience in B2C sales and customer development
readability
– Prepared and transformed data using Power Query; created customized measures with DAX
– Delivered clear and structured visualizations with intuitive navigation and relevant KPIs to support understanding and decision-making
– Continuously strengthened skills in SQL, DAX, and dashboard design through applied projectsProjects:
● Coffee Shop Sales Analysis — see on Behance: https://www.behance.net/vijose
● ArtWorks Project — interactive gallery inspired by an exhibition in Giverny: Power BI report - bit.ly/ArtWorks_vijose
Parallel project (CRM & Sales Data):
– Designed a CRM structure and sales funnel tailored for a growing B2B client
– Built a client journey map, segmented the customer base, and developed workflows for lead tracking and strategic follow-up
– Identified new growth opportunities and created a categorization logic with reminder-based reactivation flows
– Project based on prior experience in B2C sales and customer development
Certificate
BI Analyst course
Focus on Power BI, Data Modeling (Power Query, DAX), SQL, and Data Visualization
Focus on Power BI, Data Modeling (Power Query, DAX), SQL, and Data Visualization
🇬🇧English 🇫🇷French
🕐
Working hours
Monday
From09h00To19h00
Tuesday
From09h00To19h00
Wednesday
From09h00To19h00
Thursday
From09h00To19h00
Friday
From09h00To19h00
Saturday
From11h00To14h30
Sunday ▪ Today
Closed
⭐
Reviews
Please sign in as a customer to give your feedback
💬
No reviews yet.
Be the first to share your experience with this professional.