


⚡
Presentation
Power BI Dashboard Developer | Data Analytics | Business Intelligence | Sales Reporting | Data Visualization
Looking for a professional Power BI dashboard developer to transform your raw data into meaningful business insights?
I help businesses turn Excel spreadsheets and CSV files into interactive, visually appealing Power BI dashboards that make data easier to understand and analyse.
🚀 MY SERVICES
✅ Microsoft Power BI Dashboard Development
✅ Interactive Business Intelligence (BI) Dashboards
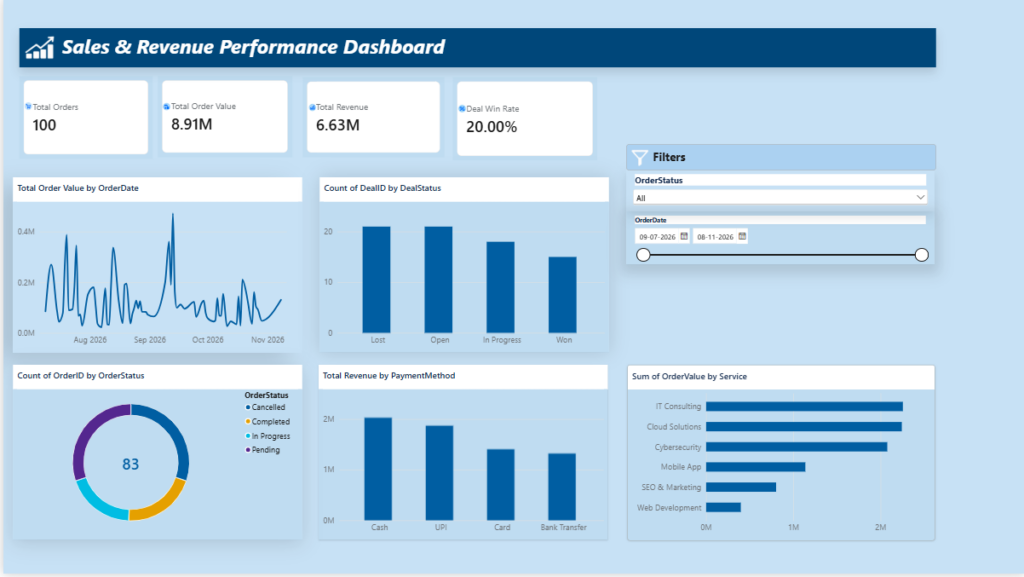
✅ Sales, Revenue and Profit Analysis
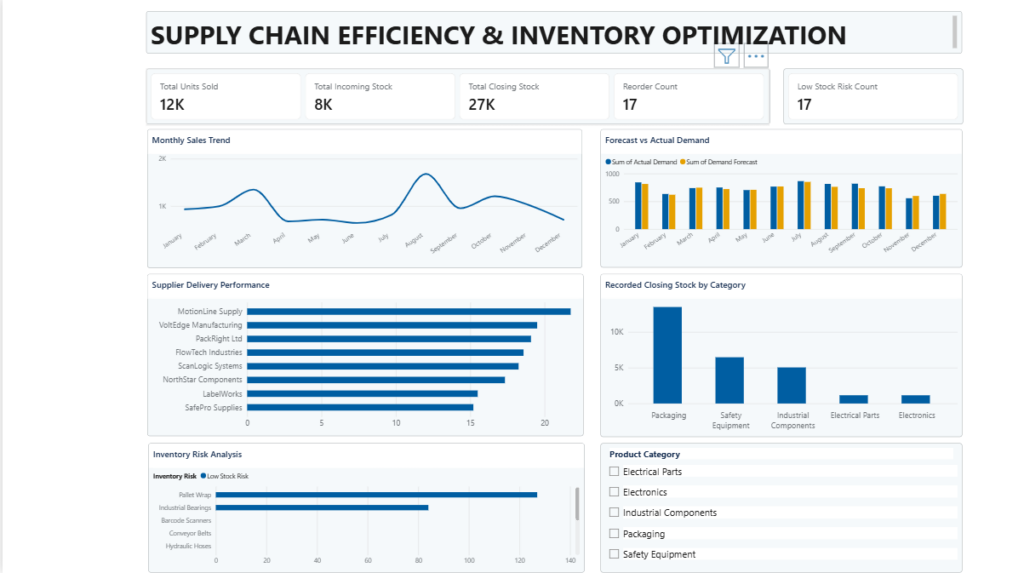
✅ KPI Tracking and Performance Reporting
✅ Data Visualization and Interactive Charts
✅ Excel and CSV Data Analysis
✅ Power Query Data Cleaning and Transformation
✅ Business Performance and Trend Analysis
✅ Product Performance and Category Analysis
✅ Dashboard Layout, Design and Usability Improvements
📊 WHAT YOU CAN EXPECT
• Clean, professional and easy-to-understand dashboards
• Interactive filters, slicers and visual reports
• Meaningful KPIs and business performance indicators
• Clear presentation of sales trends and performance metrics
• A dashboard designed around your reporting requirements
🎯 WHO CAN BENEFIT?
Small businesses, retailers, wholesalers, distributors, startups, sales teams and business owners who want to understand their data and improve their reporting process.
🔍 POWER BI KEYWORDS
Power BI Developer, Power BI Dashboard, Microsoft Power BI, Business Intelligence, Data Analytics, Data Visualization, Sales Dashboard, KPI Dashboard, Excel Dashboard, Power Query, Business Reporting, Sales Analytics, Interactive Dashboard, Data Analysis.
I focus on visual clarity, practical reporting and understanding your requirements before starting a project. I have completed a Power BI dashboard project and am developing my portfolio further.
Let's discuss your data, reporting needs and the right dashboard solution for your business.
🖼️
Portfolio
🛠️
Offered services
📋
Background
🇬🇧English
🕐
Working hours
Monday
From08h00To18h00
Tuesday
From08h00To18h00
Wednesday ▪ Today
From08h00To18h00
Thursday
From08h00To18h00
Friday
From08h00To18h00
Saturday
Closed
Sunday
Closed
⭐
Reviews
Please sign in as a customer to give your feedback
💬
No reviews yet.
Be the first to share your experience with this professional.